
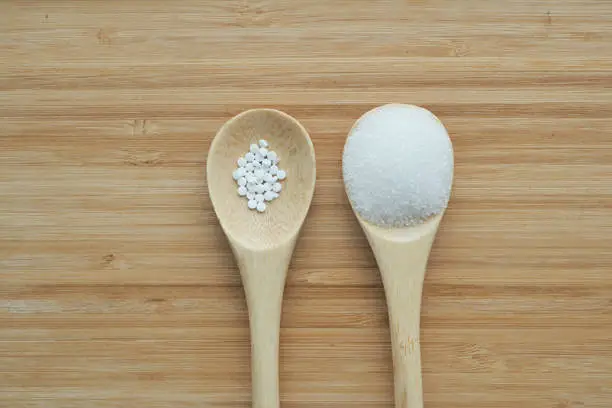
Allulose vs Erythritol: Which Sweetener Wins — and the Case for Blending
What Sets Allulose and Erythritol Apart
At first glance, allulose and erythritol look like close cousins: both are naturally occurring, nearly zero-calorie, and the most sugar-like alternatives available to formulators today. But the similarities stop at the surface. Allulose is a rare monosaccharide (D-psicose), a C-3 epimer of fructose found in figs, raisins, and maple syrup. Erythritol is a four-carbon sugar alcohol produced through glucose fermentation. That difference in chemical identity — a sugar versus a polyol — is the root of every performance gap that follows.
| Dimension | Allulose | Erythritol |
|---|---|---|
| Type | Rare sugar (monosaccharide) | Sugar alcohol (polyol) |
| Sweetness (vs sucrose) | ~70% | 60–70% |
| Calories | 0.4 kcal/g | 0–0.24 kcal/g |
| Natural sources | Figs, raisins, maple syrup | Fermented glucose (corn) |
| FDA status | GRAS, excluded from Added Sugars on labels | GRAS, listed as sugar alcohol |
| EU approval | Not yet approved | Fully approved |
| Molecular identity | C-3 epimer of fructose | 4-carbon polyol (MW 122.12) |
These numbers tell part of the story, but they don’t answer the question every product developer actually asks: which one works better in my product? That answer lives in sensory performance, application behavior, and health profile — the subjects of the sections ahead.
Taste, Texture, and the Cooling Effect: The Sensory Divide
Allulose wins on taste authenticity — it eats the closest to real sugar, with no strange sensations attached. Erythritol brings a signature cooling effect that is either a feature or a flaw depending entirely on what you’re making. This isn’t good-versus-bad. It’s functional-property-versus-functional-property.
Sweetness Profile: Intensity, Onset, and Decay
Both sweeteners clock in around 60–70% of sucrose sweetness, but the shape of that sweetness over time is where they diverge. Allulose hits quickly and fades cleanly; its sweetness half-life (the time from peak to half intensity) is about 30% shorter than sucrose. Erythritol follows a more complex biphasic curve: a primary peak at 5–8 seconds, followed by a smaller secondary peak around 18–22 seconds before tapering off, according to Cargill sensory research (Cargill, 2024).
Neither curve, on its own, perfectly mimics sugar’s smooth bell shape. But together — combined with a touch of stevia or monk fruit to bridge the intensity gap — the three create a temporal profile that closely approximates sucrose. Think of it like a fragrance: allulose is the top note, erythritol is the middle note, and stevia provides the base that ties them together.
The Cooling Effect: Erythritol’s Signature Trait
Erythritol’s cooling sensation is not a defect. It’s physics. When erythritol dissolves, it absorbs heat from its surroundings with a dissolution enthalpy of roughly −42.9 cal/g, the strongest cooling effect of any commercial sugar alcohol. By comparison, xylitol registers −36.6 cal/g and sucrose barely −4.3 cal/g.
Whether that cooling feels pleasant or off-putting depends on context. In a cold-brew energy drink or mint-chocolate protein bar, erythritol’s chill amplifies the refreshment — some brands deliberately select it for exactly this reason. In hot coffee, warm cookies, or caramel sauce, the same cooling sensation can feel misplaced, even distracting. Roughly 30–50% of consumers can reliably detect it at standard usage levels, and sensitivity varies widely by individual. The practical rule: test your specific product, with your specific target consumer, before committing.
Aftertaste and Mouthfeel: The Clean Finish Test
What you taste 10 seconds after swallowing determines whether a product earns repeat purchases. Both allulose and erythritol score well here — neither produces the bitter, metallic linger common with stevia or monk fruit used alone. But they differ in subtle ways.
Allulose leaves nothing behind. Its finish is clean and neutral. That absence of aftertaste, ironically, is what makes it remarkable. Experienced home bakers on keto forums consistently describe it as having “no aftertaste at all” and tasting “like real sugar” (ketogenicforums.com). Erythritol is clean too, but about 15–25% of users report a mild oral dryness that accumulates at high inclusion rates (>80% of the sweetener system). This isn’t an allergic reaction; it’s an osmotic effect. Erythritol’s small molecular size allows it to rapidly penetrate oral mucosal cells, creating a transient dryness that dissipates within 8–15 seconds.
Performance Across Food Applications
Taste is theory until it meets a real product. Sugar does far more than sweeten — it browns, holds moisture, builds structure, depresses freezing points, and feeds fermentation. Replacing it means replacing each of those functions, not just the sweetness. The right choice depends entirely on which functions your product needs.
Bakery and Confectionery: Browning, Moisture, and Structure
Bakery is the hardest test for any alternative sweetener, and allulose passes where erythritol stumbles. Allulose participates fully in the Maillard reaction, producing genuine golden-brown crusts and caramel notes. It begins browning around 110–120°C, notably lower than sucrose’s 160°C threshold, so dropping your oven temperature by roughly 25°F is recommended to prevent over-browning. Erythritol, by contrast, does not brown at all. Baked goods made with erythritol alone emerge pale and visually flat.
Moisture retention tells a similar story. Allulose is hygroscopic enough to keep cookies soft and cakes tender for 2–3 days post-bake. Its water activity reduction capacity is close to sucrose (aw ~0.75–0.85 range). Erythritol — one of the least hygroscopic sugar alcohols on the market, absorbing less than 2% moisture even at 90% relative humidity over 5 days — produces baked goods that dry out faster. On the plus side, erythritol provides superior structural bulk and freezing-point depression, making it valuable in specific roles. Its low solubility creates a familiar problem, though: at just ~37 g/100mL at 20°C (compared to sucrose’s ~200 g/100mL), erythritol readily crystallizes out of solution as products cool. The result is the gritty “sandiness” that has frustrated many a sugar-free baker.
Bottom line for bakery: allulose leads decisively on browning, softness, and mouthfeel. If structure or cost is the higher priority, a blend (see Section 5) is the smarter path than erythritol alone.
Beverages and Dairy: Solubility, Body, and pH Stability
Liquid systems demand high solubility, and allulose delivers — roughly 290 g/100mL at 25°C, matching sucrose. This makes it ideal for clear RTD beverages, flavored syrups, and sauces where transparency matters. Erythritol’s far lower solubility means that at high inclusion rates, you risk haze, sedimentation, or incomplete dissolution.
Mouthfeel matters too. Allulose contributes a body and viscosity close to sugar’s, giving protein shakes and dairy alternatives a satisfying roundness that erythritol alone cannot match. Erythritol’s cooling effect can be a deliberate plus in cold beverages — energy drinks and iced teas, for instance — but in hot coffee or tea, it reads as an unwelcome chill.
Both sweeteners are stable across the pH range typical of commercial beverages (pH 2.5–7.0). In dairy applications, neither interferes with typical fermentation cultures at practical levels, though allulose may be weakly utilized by certain strains — a variable to test with your specific culture. Erythritol passes through fermentation essentially untouched.
For most beverage applications, allulose is the stronger solo performer, with erythritol’s cooling effect reserved as a deliberate sensory choice for cold-product categories.
Frozen Desserts and Ice Cream: The Collaboration Zone
If there’s one application where the allulose-erythritol rivalry dissolves into partnership, it’s frozen desserts. Neither sweetener performs optimally alone. Pure allulose freezes too hard. Its freezing-point depression (~1.0°C/mol) is weaker than sucrose’s (~1.86°C/mol), leaving ice cream that fights the scoop. Pure erythritol prevents freeze-up effectively, but its solubility collapses at low temperatures (dropping to roughly 15 g/100mL at 0°C), and the resulting crystallization produces an unmistakably gritty texture.
Together, they solve each other’s problems. Erythritol handles the freezing-point work — keeping the product scoopable straight from the freezer — while allulose suppresses erythritol crystallization and contributes the creamy mouthfeel consumers expect. The typical starting ratio: 60–70% allulose to 30–40% erythritol within the sweetener system, adjusted based on target sweetness and overrun. This pairing is the strongest preview of the blending-first philosophy explored in Section 5.
Health, Metabolism, and Safety: What the Science Says
Health is the dimension where the allulose-vs-erythritol comparison has shifted most dramatically in the last three years. The 2023 study linking erythritol to cardiovascular risk changed the conversation, and follow-up research in 2024–2026 has widened the evidence gap.
| Health Dimension | Allulose | Erythritol | Key Evidence |
|---|---|---|---|
| Blood sugar impact | Reduces post-meal glucose and insulin | Neutral (no significant effect) | Multiple human trials, 2018–2023 |
| Insulin response | No stimulation at typical doses | No stimulation | Consistent across studies |
| Cardiovascular safety | Reduced platelet aggregation — potential protective effect | Increased platelet aggregation and thrombosis risk | Cleveland Clinic (Nature Medicine, 2023); Nutrients 2024 (PMC11678832) |
| Digestive tolerance (single dose) | ~24–36 g threshold | ~40–50 g threshold (better) | NOAEL data, multiple sources |
| Caloric value | 0.4 kcal/g | 0–0.24 kcal/g | FDA GRAS determinations |
| GI side effects | Bloating, gas at high doses — generally mild | Bloating, gas, diarrhea at high doses | Well-characterized for both |
| Metabolic research | Superior anti-obesity and anti-inflammatory effects in recent comparative study | Less favorable in same study | Journal of Nutritional Biochemistry, 2026 |
The cardiovascular data deserves a closer look because it is driving real formulation decisions. The Cleveland Clinic study (Witkowski et al., Nature Medicine, 2023) found that elevated blood erythritol levels were associated with increased risk of major adverse cardiovascular events, and in vitro experiments showed erythritol enhanced platelet aggregation and clot formation. A 2024 follow-up published in Nutrients (PMC11678832) added a striking contrast: under the same high-fat-diet conditions, allulose reduced platelet aggregation and suppressed pro-thrombotic gene expression, while erythritol exacerbated it. Then a 2026 comparative study in the Journal of Nutritional Biochemistry showed D-allulose outperforming erythritol on anti-obesity measures, anti-inflammatory markers, and mitochondrial function enhancement while reducing liver fibrosis in animal models.
This doesn’t mean erythritol is unsafe at normal consumption levels — regulatory bodies including the FDA continue to affirm its GRAS status. But the emerging research direction consistently favors allulose, particularly for products targeting consumers with metabolic or cardiovascular risk factors. Both sweeteners remain dramatically safer than sugar on nearly every metabolic metric. The practical takeaway: if your end consumer has diabetes, cardiovascular concerns, or is a health-maximizing early adopter, allulose is the evidence-backed choice. If digestive tolerance at high single doses is the primary concern, erythritol’s higher GI threshold (~40–50 g vs. ~24–36 g for allulose) gives it a slight edge.
The Smarter Approach: Why Blends Outperform Single Sweeteners
Here’s the shift most “allulose vs erythritol” articles miss: the food industry’s best formulators rarely pick one. They use both — plus a trace of a high-intensity sweetener — to build a sweetness system that outperforms any single ingredient. This isn’t compromise. It’s optimization.
The Science of Sweetener Synergy
Three separate mechanisms make blending work, and each addresses a weakness of the single-ingredient approach.
First, temporal curve stacking. Allulose delivers a fast onset but quick decay. Erythritol adds mid-palate persistence with its secondary sweetness peak. A small amount of stevia (typically Reb M at ppm levels) bridges the peak intensity gap. The resulting composite curve is measurably closer to sucrose’s temporal profile than any single sweetener can achieve alone. As Cargill food scientists have documented, this three-way pairing “evens out the sweetness profile” and with stevia, “gets the temporal profile closer to sugar” (Cargill, 2024).
Second, functional role division. Each ingredient does what it does best without stepping on the other’s territory: allulose handles browning and moisture, erythritol provides bulk and freezing-point control, and the high-intensity sweetener fills the sweetness ceiling. No single ingredient carries more load than it was designed for.
Third, cost structure. Allulose currently costs roughly 2–3 times more than erythritol at bulk scale. A pure allulose formulation is commercially unrealistic for cost-sensitive categories. A blended approach typically brings the per-sweetness-unit ingredient cost down to 50–65% of the allulose-only figure — a meaningful margin improvement without compromising sensory quality for the end consumer.
Practical Blend Ratios by Application
The following ratios are practical starting points, not rigid formulas. Particle size, purity, and DE value vary between manufacturers, so every blend should be validated through bench-top trials with your specific supplier’s material.
| Application | Recommended Direction | Typical Ratio Range | Key Consideration |
|---|---|---|---|
| General bakery | Allulose-dominant + erythritol | 60–80% allulose : 20–40% erythritol | Drop oven temp 25°F for browning control |
| Frozen desserts | Near-equal blend | 50–70% allulose : 30–50% erythritol | Erythritol prevents freeze-up; allulose prevents crystallization |
| RTD beverages | Allulose-dominant | Allulose为主 (NMT 3.75% of final product weight) | Erythritol adds cooling in cold formats |
| Cost-sensitive formulations | Erythritol-dominant + allulose | 70–80% erythritol : 20–30% allulose | Allulose as quality enhancer rather than bulk |
| Premium clean-label | Allulose + monk fruit | Allulose bulk + monk fruit (ppm) | No erythritol cooling; best sugar mimicry |
The performance of any blend depends on the actual ingredient specifications — particle size distribution, purity level, and residual moisture all affect how allulose and erythritol interact in your specific matrix. This is why formulation teams that work directly with manufacturers during the trial phase — rather than buying off-the-shelf spec material and troubleshooting alone — tend to reach a production-ready recipe faster.
In commercial production, the practical advantage of sourcing both allulose and erythritol from a single manufacturer shouldn’t be overlooked. When both ingredients come from the same facility, quality control variables are reduced, specification alignment is simpler, and technical support teams are working with a unified dataset rather than reconciling two separate supplier COAs. Companies like SAIGAO GROUP, which produces both allulose and erythritol in-house with customizable particle size and purity specifications, reflect this integrated approach — one that can shorten the trial-to-production timeline for formulators who want to move beyond single-sweetener limitations. If your next formulation could benefit from this kind of integrated supply, talk to a formulation specialist about your specific requirements.
Making the Right Choice for Your Product
If taste authenticity is your first priority — you want the experience closest to real sugar — allulose is your answer. If cost efficiency at high volume is the overriding concern, erythritol remains a proven workhorse. But if you want both, and most successful commercial products do, the evidence points in one direction: stop choosing. Start blending.
The broader industry trajectory is clear. Allulose production capacity continues to expand, led by manufacturers in Shandong, China, and pricing has trended steadily downward over the last three years. More brands are migrating from pure erythritol to allulose-containing blends, and allulose’s EU Novel Food approval is advancing through the regulatory pipeline. In 3–5 years, allulose is likely to shift from “premium option” to “standard configuration.” But erythritol — the most cost-effective bulking sweetener available today — isn’t going anywhere. The industry isn’t moving toward replacement. It’s moving toward blends as the default.
Think of it like choosing a vehicle. You don’t agonize over “sedan versus SUV” in the abstract. You map your actual needs — passengers, terrain, budget — and pick accordingly. Sweetener selection works the same way. The best choice isn’t allulose or erythritol. It’s allulose and erythritol, in the ratio that your product — and your customer — actually needs.
References
- Cargill. “Bringing Synergy to Sweetness: Formulating with Allulose, Erythritol, and Stevia.” 2024. https://www.cargill.com/food-beverage/doc/1432272270636/bringing-synergy-to-sweetness.pdf
- Witkowski, M. et al. “The artificial sweetener erythritol and cardiovascular event risk.” Nature Medicine, 2023. https://www.nature.com/articles/s41591-023-02223-9
- “Pathway Analysis of Allulose as a Sugar Substitute in Mitigating Thrombotic Risks in Sickle Cell Disease Patients.” Nutrients, 2024. https://pmc.ncbi.nlm.nih.gov/articles/PMC11678832/
- “D-Allulose improves mitochondrial respiratory function and alleviates obesity-induced liver dysfunction: A comparative study with erythritol in HFD-Fed mice.” Journal of Nutritional Biochemistry, 2026. https://www.sciencedirect.com/science/article/pii/S0955286325002979
- ScienceDirect. “Erythritol — an overview.” Accessed 2026. https://www.sciencedirect.com/topics/pharmacology-toxicology-and-pharmaceutical-science/erythritol
- Ketogenic Forums. “They really like allulose.” User discussion thread. https://www.ketogenicforums.com/t/they-really-like-allulose/122354/
- SAIGAO GROUP. Contact page. https://www.saigaoingredients.com/contact/
 English
  Russian
  Spanish
  French
  Arabic