
A bottle of diet soda and a pint of “no sugar added” ice cream sit in the same freezer case. Both claim to have beaten sugar. Inside the soda the work is done by a few hundred milligrams of aspartame. Inside the ice cream it is increasingly done by allulose, a rare sugar used almost spoon for spoon in place of the real thing. The two ingredients get compared constantly. Yet they are so different in kind that the comparison itself needs unpacking before any answer means anything.
One clarification first, because both names carry baggage. Allulose is also sold and cited as D-allulose or D-psicose. It is a rare sugar that occurs naturally in small amounts in foods like figs, raisins and maple syrup. The FDA has reviewed GRAS notices for it and raised no questions under intended conditions of use (Agence américaine des produits alimentaires et médicamenteux (FDA), 2025). Aspartame is the opposite in origin: a synthetic dipeptide built from two amino acids, phenylalanine and aspartic acid. It has been approved as a food additive since the 1980s and remains one of the most studied ingredients in the food supply.
| Allulose | Aspartame | |
|---|---|---|
| De quoi s'agit-il ? | Rare sugar (D-allulose, formerly D-psicose) | Synthetic dipeptide sweetener |
| D'où cela vient-il ? | Small amounts in nature; produced industrially by converting fructose | Lab-synthesized from amino acids |
| Sucrosité vs saccharose | À propos de 70% | About 200 times (Agence américaine des produits alimentaires et médicamenteux (FDA), 2025) |
| Calories | 0.4 kcal/g per FDA labeling rule | 4 kcal/g per gram, but doses are milligram-scale |
| Blood glucose effect | Negligible | Negligible |
| Regulatory class | GRAS ingredient (US) | Approved food additive with an ADI |
The last two rows of that table look identical, and that is exactly why the comparison confuses people. Both skip blood sugar. Both cut calories. But the third row, the sweetness ratio, is the real dividing line. Everything downstream changes with it: how much you use, what the ingredient does to texture, what it costs, and where a product made with it can legally be sold. Sweetness numbers that far apart mean these are not two versions of the same tool. They are two different tools.
Why They Belong to Different Toolboxes: Intensity, Dosage and Taste
If you have ever tried to swap one for the other in a recipe, you already know the numbers do not translate. The sweetener world splits into two families, and the split is mechanical. Bulk sweeteners like allulose, erythritol and maltitol are used at rates close to sugar itself. They arrive in the formula with volume, moisture and body attached. High-intensity sweeteners like aspartame, sucralose and stevia are used at rates thousands of times smaller. They contribute sweetness and nothing else: no texture, no bulk, no browning. The same split explains why diet soda can run on aspartame alone while a sugar-free cookie cannot. A dough made of flour and half a milligram of sweetener has no structure.
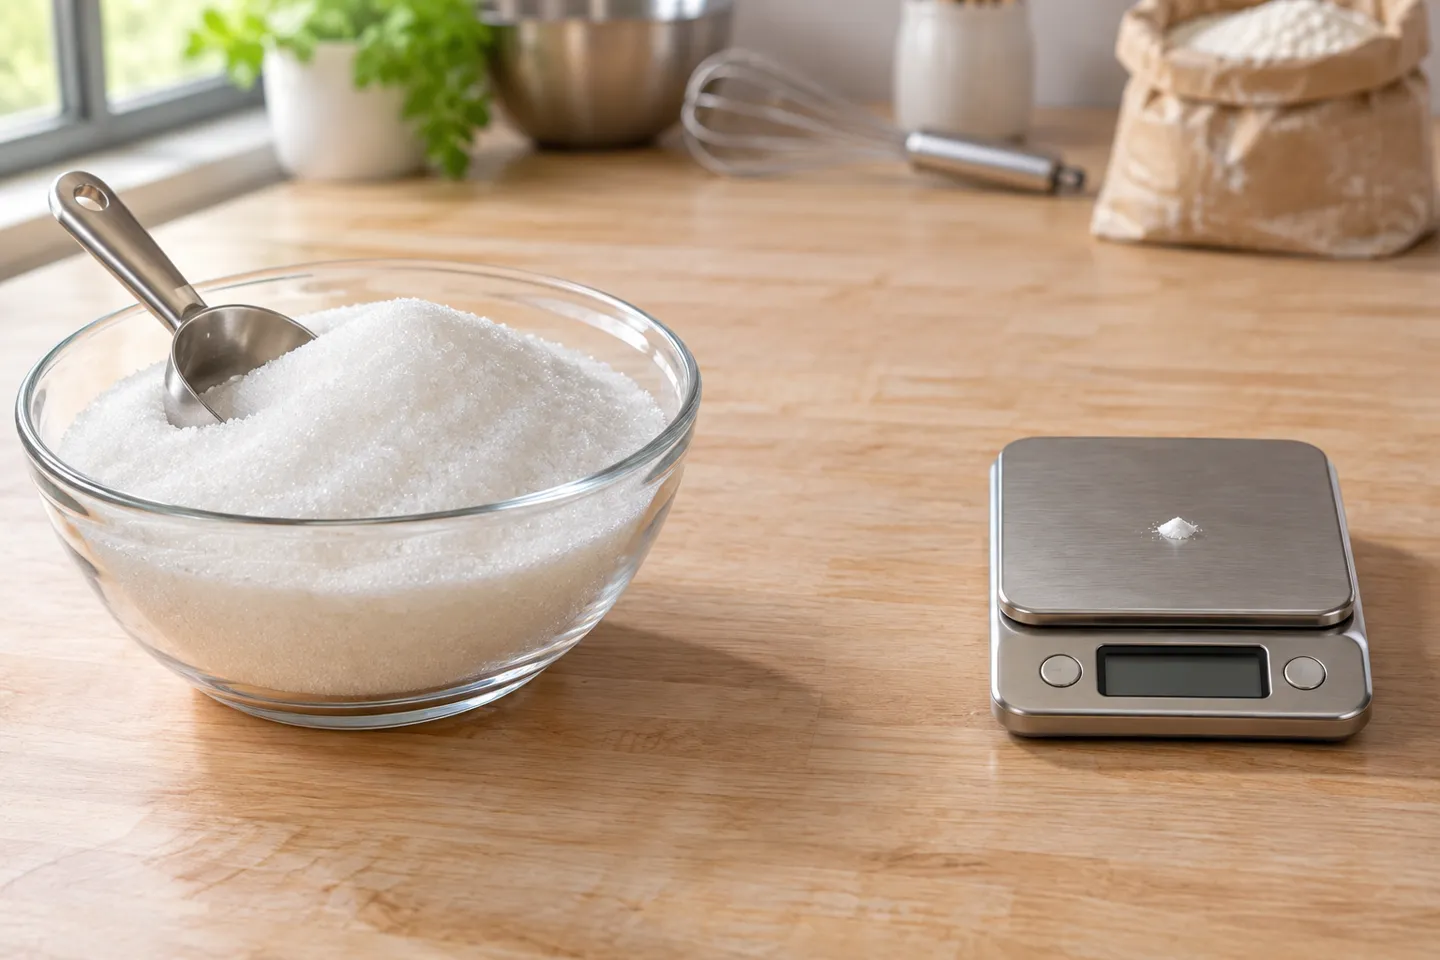
The dosing math makes the gap concrete. To match 100 grams of sucrose you need roughly 135 to 140 grams of allulose. Guides and formulators converge on multiplying sugar weight by about 1.3 to 1.4 (Beyond the Sugar, 2026). The same sweetness equals about half a gram of aspartame. That is a two-hundredfold difference in dose, and every consequence follows from it. A formula built on allulose behaves like a reduced-sugar formula. One built on aspartame behaves like an unbulked one that needs a filler somewhere else.
The swap math
100 g
sucrose, the recipe you know
≈ 140 g
allulose (×1.3 to 1.4)
≈ 0.5 g
aspartame (×1/200)
Same sweetness, three different effects on volume, moisture and texture.
Taste separates them too, in a way cooking forums argue about weekly. Allulose produces a sweetness curve close to sucrose, with a clean finish. It lacks the metallic or lingering note that some people pick up in aspartame-sweetened drinks. What it does carry is a physical limit. Consumed in one sitting above roughly 0.4 grams per kilogram of body weight, it can pull water into the gut and cause laxative effects (Han et al., 2018). For a 70 kg adult that threshold sits near 28 grams in one dose. That is comfortable in a beverage or dessert serving and easy to exceed if you snack on products made with it all day. Aspartame has no such gut effect at realistic intakes. Its constraint is different, and louder: it lives in the news cycle.
The Safety Evidence Without the Headline Noise
If you run a food brand, or you just read the news in July 2023, the safety question probably arrived as a headline. The WHO cancer agency says aspartame is possibly carcinogenic. The underlying documents say something more precise, and the distinction matters for anyone choosing between these two ingredients.
IARC, the WHO’s cancer research agency, classified aspartame as “possibly carcinogenic to humans”, Group 2B, based on limited evidence, specifically for hepatocellular carcinoma (OMS, 2023). In the same week, JECFA, the joint FAO/WHO expert committee on food additives, re-examined the risk question. It reaffirmed the acceptable daily intake of 40 mg per kg of body weight, unchanged since before. The FDA reviewed the same evidence, stated it disagrees with IARC’s conclusion, and kept its own slightly higher ADI of 50 mg/kg (Agence américaine des produits alimentaires et médicamenteux (FDA), 2025).
Two agencies, two different questions
IARC answers “can the evidence rule out harm?” (hazard identification). JECFA answers “how much is safe per day?” (risk assessment). Group 2B means limited evidence, not a daily-use ban. JECFA’s same-week answer: ADI 40 mg/kg, unchanged.
Translated into portions, the risk answer is unambiguous. A can of diet soda carries 200 to 300 mg of aspartame. WHO’s own calculation puts the ADI breach above 9 to 14 cans per day, every day, for a 70 kg adult (OMS, 2023). One real constraint does exist, and it is not dose-related. People with phenylketonuria (PKU) must avoid aspartame because they cannot metabolize the phenylalanine it releases. That is why labels must carry a phenylalanine statement (Agence américaine des produits alimentaires et médicamenteux (FDA), 2025).
Allulose’s evidence file is shorter, and its open questions are different. You may have seen the claim that allulose acts like GLP-1 and supports weight management. That claim runs ahead of the data. A registered German crossover trial (LisA) was set up specifically to test allulose’s GLP-1 effect against aspartame. It completed sample collection in late 2023 with 10 participants, and its confirmatory analysis is still pending (Busch et al., 2026). “Evidence remains scarce” is the paper’s own wording. What is settled is glycemic behavior: allulose does not raise blood glucose, which is why keto and diabetic-friendly products build on it.
So who should actually switch? If you are keto or managing blood glucose, both options leave glucose alone. The choice there is about taste and tolerance, and anyone with known gut sensitivity should dose allulose within the 0.4 g/kg limit. If you formulate for a mass market where a “no artificial sweeteners” claim sells, allulose is the only route to that claim among the two. If your products serve PKU customers, aspartame is disqualified outright. Nobody needs to switch because of a hazard classification alone.
8.6%
allulose demand CAGR
283,4 millions de dollars américains
taille du marché, 2023
509,3 millions de dollars américains
prévisions, 2030
Beverages lead all applications at 9.0% CAGR.
Source for all figures above: Grand View Research, 2024.
That number is the quiet answer to the safety noise. Regulators kept their conclusions. Brands moved anyway, and the spending followed consumers who read “possibly carcinogenic” and started checking labels. The rest of this article is about what that shift means for the people who actually have to choose. Product developers first.
Choosing for a Product: Cost, Heat, Texture and Where You Can Sell It
Cost in use: the per-sweetness mistake
Comparing a kilo of aspartame with a kilo of allulose on price is an accounting error, because they are sold in fundamentally different units of usefulness. Aspartame is bought by the gram of sweetness it delivers. At 200 times sucrose, a few hundred grams sweetens a syrup tank, so its per-kilo price lands as a rounding error in most beverage cost sheets, however volatile it gets. Allulose is bought by the kilo of bulk it replaces. You use it at 1.3 to 1.4 times the sugar weight, so its landed cost per tonne of finished product is materially higher than sugar’s, let alone aspartame’s. Practitioner discussions of why mainstream drinks have not switched converge on this point first: cost at required dosage, ahead of every other factor (r/foodscience discussion, 2024).
The defensible way to compare is cost per unit of sweetness delivered, then priced against what the bulk brings. A kilo of allulose does more than sweeten. It contributes solids, moisture retention, freezing behavior and, in baked goods, color. If your formulation needs those functions anyway, part of the allulose invoice is buying texture you would otherwise purchase as separate stabilizers or fillers. If your product is a clear beverage where the only requirement is sweetness, that same kilo buys you nothing aspartame does not, and the comparison turns unfavorable. Run the arithmetic per 1,000 liters or per tonne of dough, not per kilo of ingredient.
Heat, browning and texture: where each one breaks
Aspartame’s known weakness is thermal. The FDA’s own guidance states the constraint plainly: “Aspartame is not heat stable and loses its sweetness when heated, so it typically isn’t used in baked goods” (Agence américaine des produits alimentaires et médicamenteux (FDA), 2025). Heat processing, hot-fill beverages and long ambient shelf life all chip away at its sweetness. That is why aspartame-built products cluster in chilled distribution.
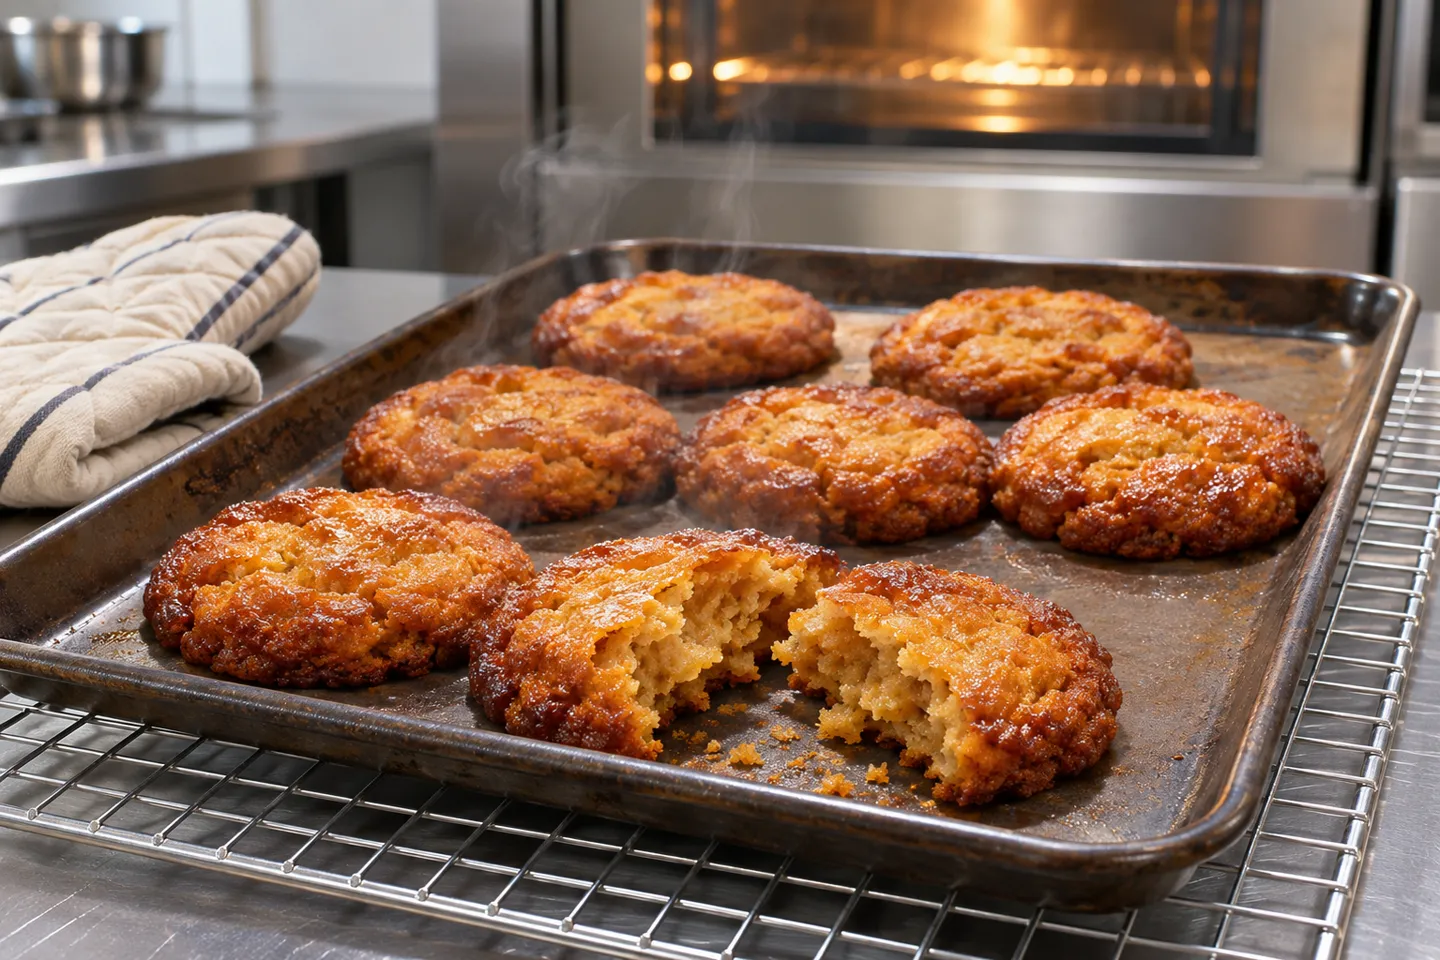
Allulose fails in the opposite direction: it reacts too well. Chemically it is a reducing sugar, so it participates in Maillard browning the way glucose does. Baking trials confirm that increasing allulose levels raises browning and Maillard intermediates measurably (Wittland et al., 2026). In a cookie that is a feature with a setting to tune, and the practical fix is a modest oven temperature reduction plus earlier doneness checks. In frozen desserts the story is texture. Allulose’s smaller molecule depresses the freezing point more than sucrose per unit weight, producing a softer, more scoopable result. Trade guidance recommends limiting the net freezing point shift to under about 0.5°F when reformulating (Dairy Foods, 2016). It also holds water, which slows staling in baked goods and changes water activity assumptions in your shelf-life model.
Blending and the market-access map
Because the two families fail in opposite places, real products usually blend. An allulose base carries bulk, moisture and browning. A high-intensity sweetener closes the sweetness gap that allulose’s 70% leaves open; stevia, monk fruit and sucralose are the common partners. The same logic explains the industry’s switching pattern. Practitioners on formulation forums consistently report that flagship reformulations fail taste testing and shelf trials, while new launches carry the new sweetener system first (r/foodscience discussion, 2024). Plan allulose adoption as a new-SKU decision, not a line-wide swap.
Before any of that, check the map, because market access is the hardest constraint in the system. The United States allows allulose as a GRAS ingredient and excludes it from Total and Added Sugars on the label, counting it at 0.4 kcal/g (Agence américaine des produits alimentaires et médicamenteux (FDA), 2020). Australia and New Zealand approved it as a novel food in 2024 with a stated intake cap of 0.4 g/kg bw per occasion (FSANZ, 2024). Japan and Korea have permitted it for years. The European Union, by contrast, has not authorized it under the novel food regulation. Canada has not yet added it to its approved lists. The same bottle can be legal in Chicago and unsellable in Toronto (Icon Foods, 2026). Export-oriented formulations need the destination list written down before the sweetener system is chosen, not after.
Application fit: allulose, aspartame, and blends
| Product scenario | Recommended system | Pourquoi ? | Boundary to verify first |
|---|---|---|---|
| Chilled beverage (cola-style) | Keep aspartame/AceK or blend in allulose for premium SKUs | Aspartame cost-per-sweetness still wins in clear chilled drinks | Taste-match against incumbent; destination market list |
| Hot-fill or baked beverage | Allulose-based blend | Aspartame loses sweetness under heat (FDA) | Dose at 1.3-1.4x sugar weight; check browning targets |
| Cookies and baked snacks | Allulose with texture system | Contributes browning and moisture retention aspartame cannot | Reduce oven temp ~25°F; recheck water activity and shelf life |
| Ice cream and frozen dessert | Allulose (optionally + high-intensity) | Freezing point depression gives softer scoop | Cap net FPD shift near 0.5°F; stabilizer adjustment |
| Confiserie | Polyol family (maltitol, isomalt) ± allulose | Crystallization and gloss need polyol behavior | Hygroscopicity and digestive tolerance labeling |
| tabletop sachets | High-intensity, or allulose + high-intensity blend | Bulk and dissolution drive the format | Dissolution speed and caking in humid climates |
| Supplements and protein powders | Allulose + high-intensity blend | Clean-label claim plus dosable sweetness | Single-serving GI tolerance; market access list |
How to Qualify a Sweetener Supplier Before You Commit
Once the formulation decision points at allulose, the risk moves from chemistry to procurement. This is a young, premium category where supplier quality varies more than in commodity aspartame. A qualification sequence, done in this order, catches almost every failure mode before money moves.
Papers before price
Ask for the specification sheet before the quote. Read it against four items: purity, moisture, ash and heavy-metal limits (lead and arsenic), plus particle size distribution if you buy powder for a dry blend. Then ask for the certificate of analysis for a recent actual lot, not a template. Batch-to-batch consistency is the single most common gap between suppliers in this category. Two extra documents separate serious suppliers from repackagers. One is acidic-application shelf-life stability data, since acidic beverages are the hardest matrix for sweetness retention. The other is heavy-metal test reports. If a supplier hesitates on either, the price advantage is not worth it.
Shortlisting suppliers? Saigao sends the allulose spec sheet and a recent-lot COA with every sample request.
Demander la fiche techniqueCertifications and compliance that travel with the drum
The certification set to require is standard and checkable. ISO 9001 plus ISO 22000 or HACCP covers the plant. Kosher and Halal cover market reach. Non-GMO verification matters because for allulose it means tracing the corn or tapioca feedstock, since most production starts from starch sugars. Product conformance to FCC, USP, BP or EP standards should be stated on the spec sheet, not just claimed in a brochure. Tie every document back to the market-access map from the last section. A lot that cannot show compliance documentation is a lot your regulatory team cannot defend in an audit.
Run the sample, then the terms
The last step runs on the factory floor, not in your inbox. Order samples and run them through your own application test, the same way ingredient distributors test 100 to 500 grams before quoting a brand customer. Confirm the grade performs in your matrix, not on paper. On commercial terms, ask for four commitments in writing. First, flexible minimums on bulk: 1 ton is a workable floor. Second, lead times you can plan around: stocked powder within about a week, custom or liquid lots in the 20 to 30 day range. Third, declared shelf life: three years for powder, two for syrups. Fourth, an after-sales clause with a response clock and third-party testing arbitration for quality disputes. A supplier who commits to all four is rare enough to be worth keeping.
Supplier qualification checklist
- Spec sheet with purity, moisture, ash, heavy metals, particle size
- COA from a recent real lot
- Acidic-matrix stability data on request
- Heavy-metal test reports
- ISO 9001 / ISO 22000 / HACCP certificates
- Kosher, Halal, non-GMO verification
- FCC/USP/BP/EP conformance stated
- Sample tested in your own application
- MOQ and lead time in writing (stock ~1 week, custom 20-30 days)
- Shelf life declared (powder 3 yrs, liquid 2 yrs)
- After-sales response clock + third-party arbitration clause
What This Means for Your Sweetener Portfolio
If you distribute ingredients rather than formulate with them, the comparison above reads differently. It is a category decision. The formulation logic proved the two sweeteners are not substitutes. The cost logic proved they earn margin differently. The market map proved they sell in different territories. Those three facts reshape a portfolio.
They are not substitutes, so inventory logic cannot treat them as one category. A brand switching its cola away from aspartame does not automatically become an allulose customer. Practitioner experience says flagship swaps fail and the demand arrives through new product launches instead (r/foodscience discussion, 2024). They earn margin differently. Aspartame is a commodity where the sale is price and supply reliability. Allulose is a premium ingredient where the sale is function plus documentation: market access lists, stability data and blending support. One side turns on volume, the other on service. They sell in different territories. An allulose position is only an asset in markets that permit it, which is why the documentation travels with the drum.
The practical structure, then, has two tracks. Run aspartame as a price-driven, turnover commodity. Run allulose as a light-stock, heavy-paperwork premium line, quoted per opportunity with compliance files attached, and aimed at the new-product pipelines where the category’s 8.6% annual growth actually materializes. The downstream pitch changes accordingly. It stops being “replace your aspartame” and becomes “which of your products in permitted markets needs sugar-like bulk without sugar’s calories”.
The stocking logic works because the supply side does not force you to warehouse the bet. Our allulose line ships stocked powder within a week. Custom and liquid lots are produced to order in the 20 to 30 day range, with bulk MOQ from 1 ton (SAIGAO’s allulose line). Distributors can therefore quote against demand and keep the paper trail current instead of tying capital to pallets. We would rather you commit storage space to the commodity side of your portfolio and let the premium category move on order.
Allulose rewards the buyers who check documents before prices: the suppliers worth keeping are the ones who send the paper with the drum.
Get Allulose Specs, COAs and Samples From Saigao
Stocked powder ships within a week; custom and liquid lots run 20 to 30 days; bulk MOQ from 1 ton with the compliance file attached.
Request a Sample and QuoteRéférences
- U.S. FDA. “Aspartame and Other Sweeteners in Food.” 2025. fda.gov
- WHO. “Aspartame hazard and risk assessment results released.” 2023. who.int
- U.S. FDA. “Guidance for Industry: The Declaration of Allulose and Calories From Allulose on Nutrition and Supplement Facts Labels.” 2020. fda.gov
- Grand View Research. “Allulose Market Size, Share & Growth Analysis Report, 2030.” 2024. grandviewresearch.com
- Busch S, et al. “Effects of Allulose vs Aspartame Consumption on Postprandial GLP-1 Profiles and Metabolic Health: Protocol for a Randomized, Crossover, Double-Blind, Placebo-Controlled Trial.” JMIR Research Protocols. 2026. pubmed.ncbi.nlm.nih.gov
- Han Y, et al. “Gastrointestinal Tolerance of D-Allulose in Healthy and Adult Subjects.” Food Science & Nutrition. 2018. pmc.ncbi.nlm.nih.gov
- FSANZ. “Approval Report: Application A1247, D-allulose as a Novel Food.” 2024. foodstandards.gov.au
- Wittland S, et al. “Allulose as alternative for sucrose in baked goods.” Journal of Food Science. 2026. sciencedirect.com
- Dairy Foods. “Using ‘rare’ sugars in ice cream, frozen dessert formulas affects everything.” 2016. dairyfoods.com
- r/foodscience. “How come mainstream soft drinks brands don’t use modern sweeteners?” 2024. reddit.com
- Beyond the Sugar. “Baking with allulose: temperature, ratios.” 2026. beyondthesugar.com
 English
 Russian
 Spanish
 French
 Arabic